With the loss announced by JPMorgan Chase last week there are, once again, loud and varied denunciations of Value at Risk or VaR. Unfortunately, such talk sheds little light upon and often shows misunderstanding of the underlying issues.
Take the statement from the Lex Column of the Financial Times from Monday, May 14th:
Why does VaR seem limited almost to the point of uselessness? One reason is that it does not offer an absolute guarantee that it will do what it says on the tin. It represents the potential losses in a trading portfolio over a given period of time at a given level of confidence. That covers almost all eventualities. The trouble is that problems usually arise in the ones that are not covered.
First, let’s start with that “absolute guarantee”. Anybody remotely acquainted with financial markets, and the writers of the Lex Column in particular, should know that there are no “absolute guarantees” in financial markets, or in life for that matter. (Except, maybe, for death and taxes. Although some politicians seem to be working on taxes.)
VaR only promises to give an estimate of the minimum or typical amount we might lose on the worst trading day during, say, a year. It doesn’t represent the worst loss we might suffer. In financial markets, whatever our worst-case scenario, something worse will happen sometime, somewhere. Although some authors talk about VaR as the “statistically worst-case loss,” this is a horribly misleading idea. VaR should be viewed as a periodically occurring event that, while not likely, we should be perfectly comfortable with. We should think of VaR as providing a scale for possible large losses, not a maximum loss or worst-case scenario.
Let’s examine what VaR says it will do “on the tin”. Doing so takes a little bit of work but we will be well-rewarded by better understanding of what VaR can or cannot do.
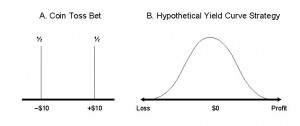
Financial risk is in some ways so simple, because it is all about money – profit and loss and the variability of P&L. What do we mean by P&L and the variability of P&L? Start with a very simple financial business, betting on the outcome of a coin flip. We make $10 on heads and lose $10 on tails. We could graph the P&L distribution as in panel A of Figure 1. The probability is one-half of losing $10 and one-half of making $10.
This kind of distribution shows us the possible outcomes (possible losses and gains along the horizontal) and how likely each of these is (probability along the vertical). This is fundamental to how we think about financial risk – it shows us the possible profits or losses.
In fact, this distribution is what we mean by financial risk – the possibility that we may make money but also may lose money.
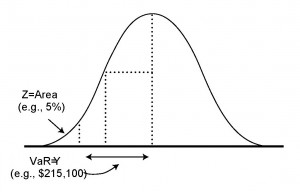
There are two issues we need to discuss regarding this distribution. First, we would like some simple way to summarize this distribution. That is where VaR comes in. VaR is simply a point on the left hand side of the distribution. Look at Figure 2 – the VaR is the point on the distribution labeled “$215,000”. We have simply chosen a point on the left hand part of the distribution, where there is 5% chance that the loss will be worse.
In other words, there is a 5% or 1/20 chance that the loss will be worse than $215,000. This is why I say the VaR is the “minimum or typical amount we might lose” – in this case on the worst trading day out of 20. If we chose 0.4% instead of 5% the point would be further out on the left, and then the VaR would be the minimum or typical amount we might lose on the worst trading day in a year (worst out of 250 days).
But look at the figure – it is easy to see things could be worse, that there are losses further out to the left. The VaR never tells us the worst that could happen – it only sets the typical bad day (out of 20 days for 5%, out of 250 days for 0.4%). Things can always get worse, so if we see something worse than the VaR that may be the result of simple bad luck.
There is a more fundamental issue with the distribution, however. We never know the distribution with certainty. We never can know the future, but the distribution we care about is the distribution of profit and loss over the coming days, weeks, or months. We can never know this distribution with any certainty. We can estimate, make a guess at it, but we never can know it for certain.
But we have to learn to live with uncertainty, randomness, luck. The world is full of uncertainty, assumptions, guesses, and estimates. That is life. Yes, we have to make sure our estimates and assumptions are good and reasonable, but we can find no “absolute guarantees” in this world. When the Financial Times says “It [VaR] is based on assumptions, uses historical data …” that cannot be a criticism – it is simply stating the obvious. Anyone who does not like the uncertainty, the assumptions, should probably not be in business.
There is one final and fundamental problem with VaR, an existential problem to which there is no solution. That problem is extreme or tail events, outliers.
The loss at JPMorgan is an outlier, an extreme event. VaR, and quantitative risk measures in general, do not catch extreme events. But extreme events are, by their very nature, difficult to quantify. Experience does not catch extreme events. Imagination can try, but even that fails. Extreme events are extreme and hard to predict, and that is just the way life is. We need to recognize this limitation, but it is hardly a failure of VaR or quantitative techniques. To criticize VaR and the field of risk measurement because we cannot represent extreme events is just silly, like criticizing the sky because it is blue. Anybody who does not like extreme events should not be in the financial markets. Luck, both good and bad, is part of the world. We can use quantitative tools to try to put some estimates around extreme events, but we have to learn to live with uncertainty, particularly when it comes to extreme events.
There is much more, about VaR, volatility, extreme events, and other quantitative risk issues in my new book, Quantitative Risk Management published by Wiley.


