Summary
Personal income figures released today are some of the best economic news to come out recently, contrary to what most commentators have claimed. The headlines report that spending and income has stagnated, but the real news is in the revisions and the fact that spending has not grown as much as previously reported. The downward-revised spending is good news because it provides evidence that households are adjusting to reduced wealth. There is still plenty of bad news – most of the increased savings rate is due to fiscal stimulus and when that stimulus is reversed we are likely to see a renewed recession – but the situation is better than we thought a month or two ago.
The revisions have been substantial and back to 2008. The most important was a downward revision in the overall level of spending (personal outlays and personal consumption expenditures). This flowed through to savings, implying an upward revision on the savings rate. Most notably, the revisions were larger for more recent months. This means that the increase in spending that had been reported in the past few months has now been revised to pretty flat spending.
This is all good news because, in my view, a robust recovery will occur when (and if) households have finished adjusting their spending to new, lower, levels of lifetime wealth. The 2008-2009 recession and the current recovery are all about households de-leveraging and adjusting spending levels downwards relative to income. Any evidence that the adjustment process is proceeding has to be good news because it signals that a robust and sustained recovery will be that much sooner.
The fiscal stimulus, both government spending and tax cuts, was a policy effort to offset the slow-down in spending. Perversely the policy may have simply delayed the process. Since the bubble burst in 2007-2008 all forms of wealth have fallen – falling housing prices have reduced real estate holdings, stock markets have fallen or stagnated, and probably most importantly employment and wage earnings have fallen. The fall in lifetime wealth should naturally induce some adjustment in consumer spending. The recession was simply that adjustment of spending to new levels of perceived wealth. A robust recovery will take hold when households are comfortable with their new level of spending relative to income.
Table 1 shows the current (revised) savings rate and spending rates, quarterly. The spending rate for the second quarter of 2010 is below where it was in 2007. Table 1b shows revisions. The level of spending has been revised down and savings up. Prior to the revisions the spending rate was reported as having increased substantially from 2008 through 2010.
Source: Bureau of Economic Analysis and Author’s Calculations
The news from the data are not all good, by any means. Reduced taxes are the main source of the increase in the savings rate. The savings rate increased from the low of 1.6% to 5.7% (a change of 4.1 percentage points) but most of that (3.4 percentage points) was due to lower taxes – i.e. lower spending contributed little (0.7 percentage points).
There is no doubt trouble stored up for the future. I don’t think the imbalances that led to the financial crisis of 2007-2009 are fully redressed (at least in the US). Spending is supported by low taxes (an explicit government policy to ameliorate the recession of 2008-2009). Eventually taxes will have to rise to fund the government deficit, and this will put pressure on spending. Either the savings rate will fall (building future imbalances) or spending will fall (recession). Nonetheless the news is better than it was – prior to revisions spending actually increased and reduced savings.
Longer-term trends (over the past two decades) are:
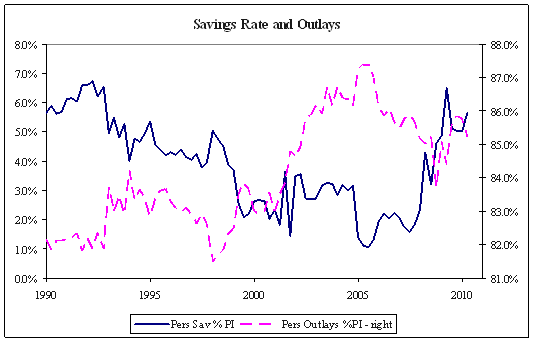
• Savings rate (more accurately, what is left over from current spending) fell from roughly 6% of income to below 2% in 2007/2008 and has now rebounded to almost 6%.
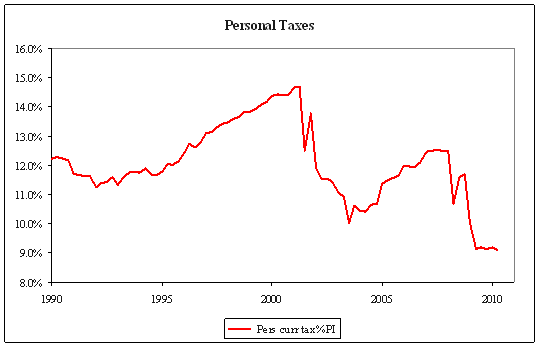
• Taxes rose during the late 1990s but fell dramatically post-2000, and again in 2008.
• Spending has risen from about 83% of income (1990s) to over 87% in 2005 and is now roughly 85%. It is still high by historical standards and supported by low taxes, but not as high as during the bubble.
Household debt (measured in the Federal Reserve’s quarterly flow of funds reports) has fallen since early 2008, from 96.4% of GDP in QI 2008 to 93.6% in QIV 2009. This is good news and shows households have started de-leveraging. Unfortunately the increase in government debt has been far larger. According to the OECD, central government debt for the US grew by $2.5tn from 2007 to 2009, or from 35.6% of GDP to 53.1%. Future tax liabilities, which are a future liability and thus function as a sort of implicit household debt, have probably offset any decrease in directly-owned household debt. The net result is that household leverage has probably not decreased much, if at all, over the past three years.
Decomposition of Movements in Spending and the Savings Rate
Table 1 shows the savings rate. The definitions of savings and spending rates, together with a decomposition of savings as a percent of personal income, is discussed here.
Economists commonly consider the “savings rate,” which is the difference between current income and spending – the excess of income left after spending and taxes are accounted for. The definition is:
Savings Rate = (Disposable Personal Income – Personal Outlays) / Disp Pers Inc .
(This “savings rate” is not exactly savings as one usually thinks of savings, but rather a definition of the excess of income over spending in the aggregate economy. One could equally well talk of the “spending rate” – Outlays / Income – which is just one minus the “savings rate”.)
It is useful to decompose the rise in the savings rate in order to understand it a little more. To do so it is useful to consider savings as a percent of total personal income. Basically,
Disposable Personal Income = Personal Income – Personal Current Taxes
Savings = Disposable Personal Income – Personal Outlays
The standard definition of the savings rate is savings divided by Disposable Income:
Savings Rate (DPI) = (Disposable Personal Income – Personal Outlays) / Disp Pers Inc
= 1 – Personal Outlays / Disp Pers Inc
We can, however, define a savings rate divided by personal income that is only slightly different:
Savings Rate (PI) = (Personal Income – Personal Current Taxes – Personal Outlays) / Pers Inc
= 1 – Pers Curr Taxes / Pers Inc – Pers Out / Pers Inc
Since DPI and PI differ only by Pers Curr Taxes, which has monthly changes that are not large relative to the level of DPI and PI, the two measures will be very much the same. The advantage of the second is that we can decompose changes in that savings rate into changes due to taxes and that due to changes due to outlays (spending).
Figure 1 shows the longer trends in the savings rate and outlays – the savings rate has been trending lower for the past couple decades but with a sharp rebound starting in 2008. Spending has increased, with a particular jump about 2001. Figure 2 shows personal current taxes. This fell starting 2002 (the George W. Bush tax cuts), and then again starting in 2008 (in response to the recession). Taxes will no doubt rise at some point, in response to substantial government deficits.
Source: Bureau of Economic Analysis and Author’s Calculations


